This is the fifth in an ongoing series illustrating the relationship of Drawdown strategies to landscape architecture. For context, read the initial post here.
Beyond looking at a specific strategy, in this post I wanted to focus on a specific sector that compiles what seems most relevant to landscape architecture – Buildings and Cities. This includes a range of strategies (see below) that cumulative have the ability to reduce CO2 emissions, in an optimum scenario, by over 100 gigatons by 2050. Not all of these are within the landscape architectural purview, but this sector does have the most disciplinary alignment with architecture, planning, and development related climate strategies within Drawdown.

The book provides some shorter introductions on this topic in the sector introduction which, amongst other things, provide the obligatory reference to both Jane Jacobs and does include a mention of Ian McHarg. It’s important here that it specifically addresses the key role of cities, not just as part of the problem, but part of the solution, mentioning how scientists and designers are “mapping how cities can be more productive in terms of air, water, flora, fauna, pollinators, and carbon sequestration than the original lands they were built upon.” (83) Using this information is a re-positioning for a new wave of architects, engineers and landscape architects.
“[These designers] …now help reimagine the life of cities with Mother Nature and human nature as their twofold template.” (83)
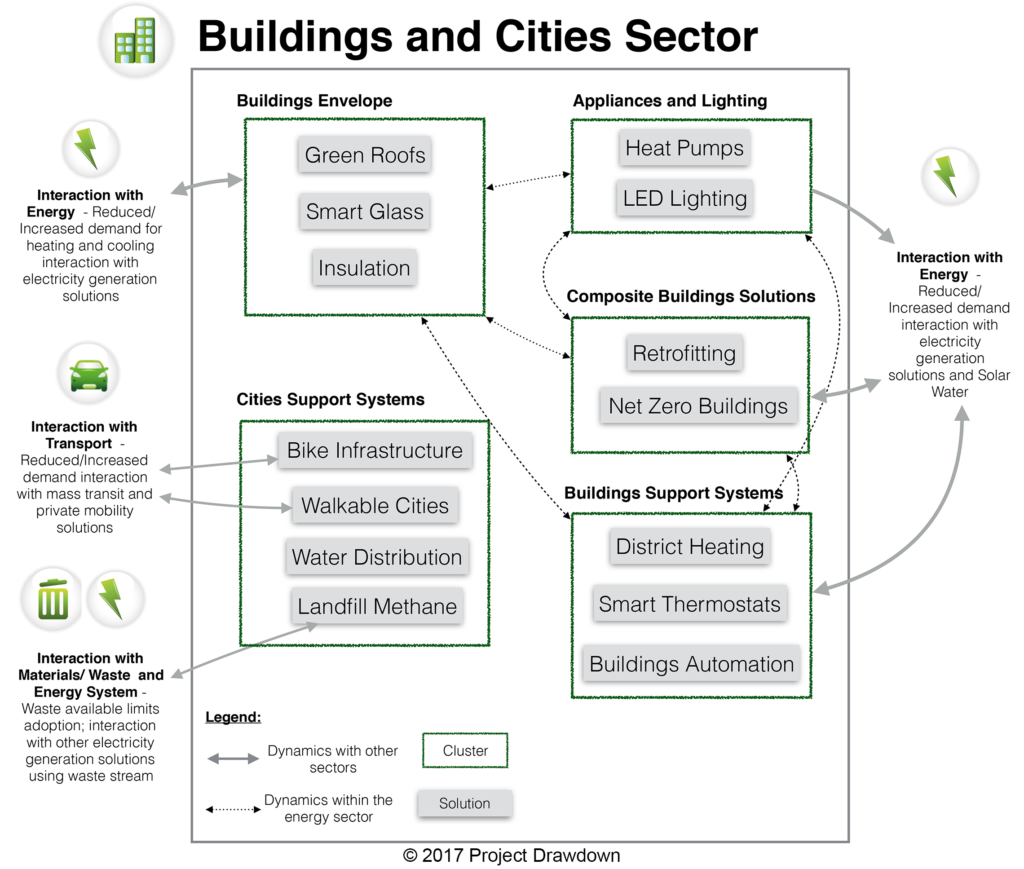
There is a wealth of info on the website to highlight these sectors. For instance, the aggregations, or ‘clusters’ of the sector fall into a few key areas, like building envelope, appliances, composite building solutions, city support systems, and buildings support systems. This aligns with the initial post, where I make the distinction between things that relate to landscape and site, that those that are more about cities and systems. The figure also identifies dynamics with other Drawdown sectors, as well as looking at dynamics within the energy sector.

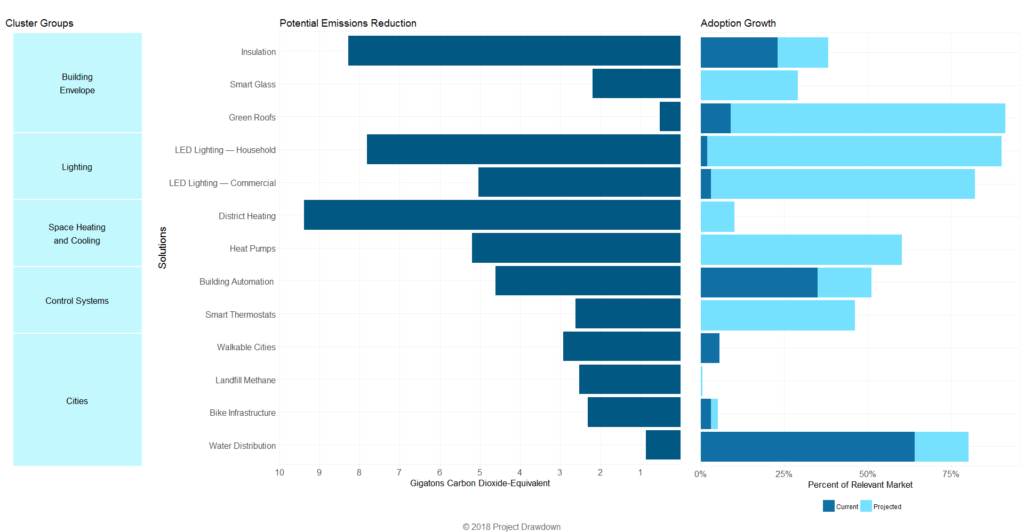
Within the sectors themselves, some additional analysis both of individual strategy potential and how much these markets can grow (this one is easier to read if you enlarge it, so click to see the specifics). I’ve mentioned Green Roofs already, which comparatively is relative minor in the contribution to other Building and City strategies, but still has the ability to contribute to overall reversal of global warming. I will delve into a couple more specific strategies in future posts, and highlight how landscape architects can increase awareness of ways in which we can leverage our portion of these others, on the site side, for instance, such as LED lighting, Building Automation and Insulation, and on the Cities side, with Walkable Cities, Bike Infrastructure, and Water Distribution.

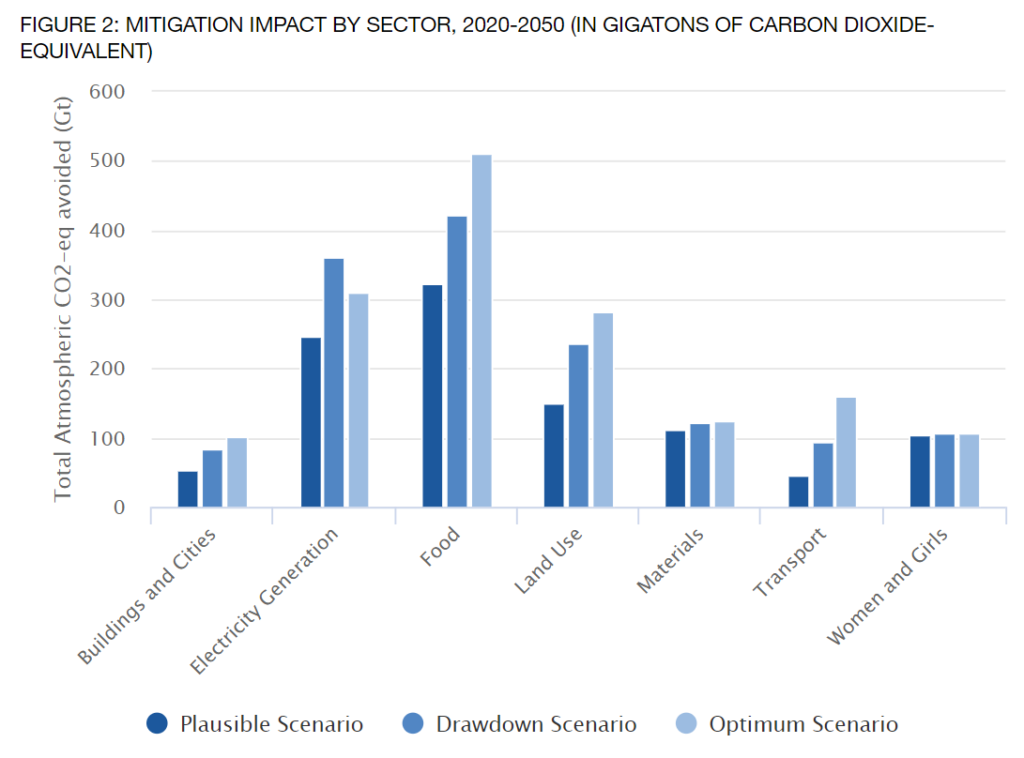
It’s also really interesting to see how small of a portion of overall CO2 reductions relative to all of the Drawdown strategies together, which pales in contrast to Electricity, Food and Land Use sectors. This is not to diminish the role, but also has to do with how savings are accounted. As mentioned on the website: “Readers may be surprised to see Buildings and Cities play a smaller role in the pathway to drawdown than might be expected. This might have much to do with where Project Drawdown has drawn the boundaries for assessment of the sectors. Many other studies include the impact of transitioning the grid to more diversified renewable sources as part of the built environment. In this case, we have allocated that mitigation potential to the Energy Sector. “

The takeaway, again, is we’re not going to solve the climate crisis through just designing or adapting climate friendly buildings, landscapes and cities. There is not one silver bullet solution, and success will be measured in the cumulative actions aggregated together. Even as a ‘minimal’ strategy, the ability to reduce CO2 levels by 100 or more gigatons in the next 30 years through this work is worth our time. There’s a ton more in terms of detail, and many of these figures have more interactive detail, but this short summary gives you a snapshot of the ‘sectors’ in Drawdown.
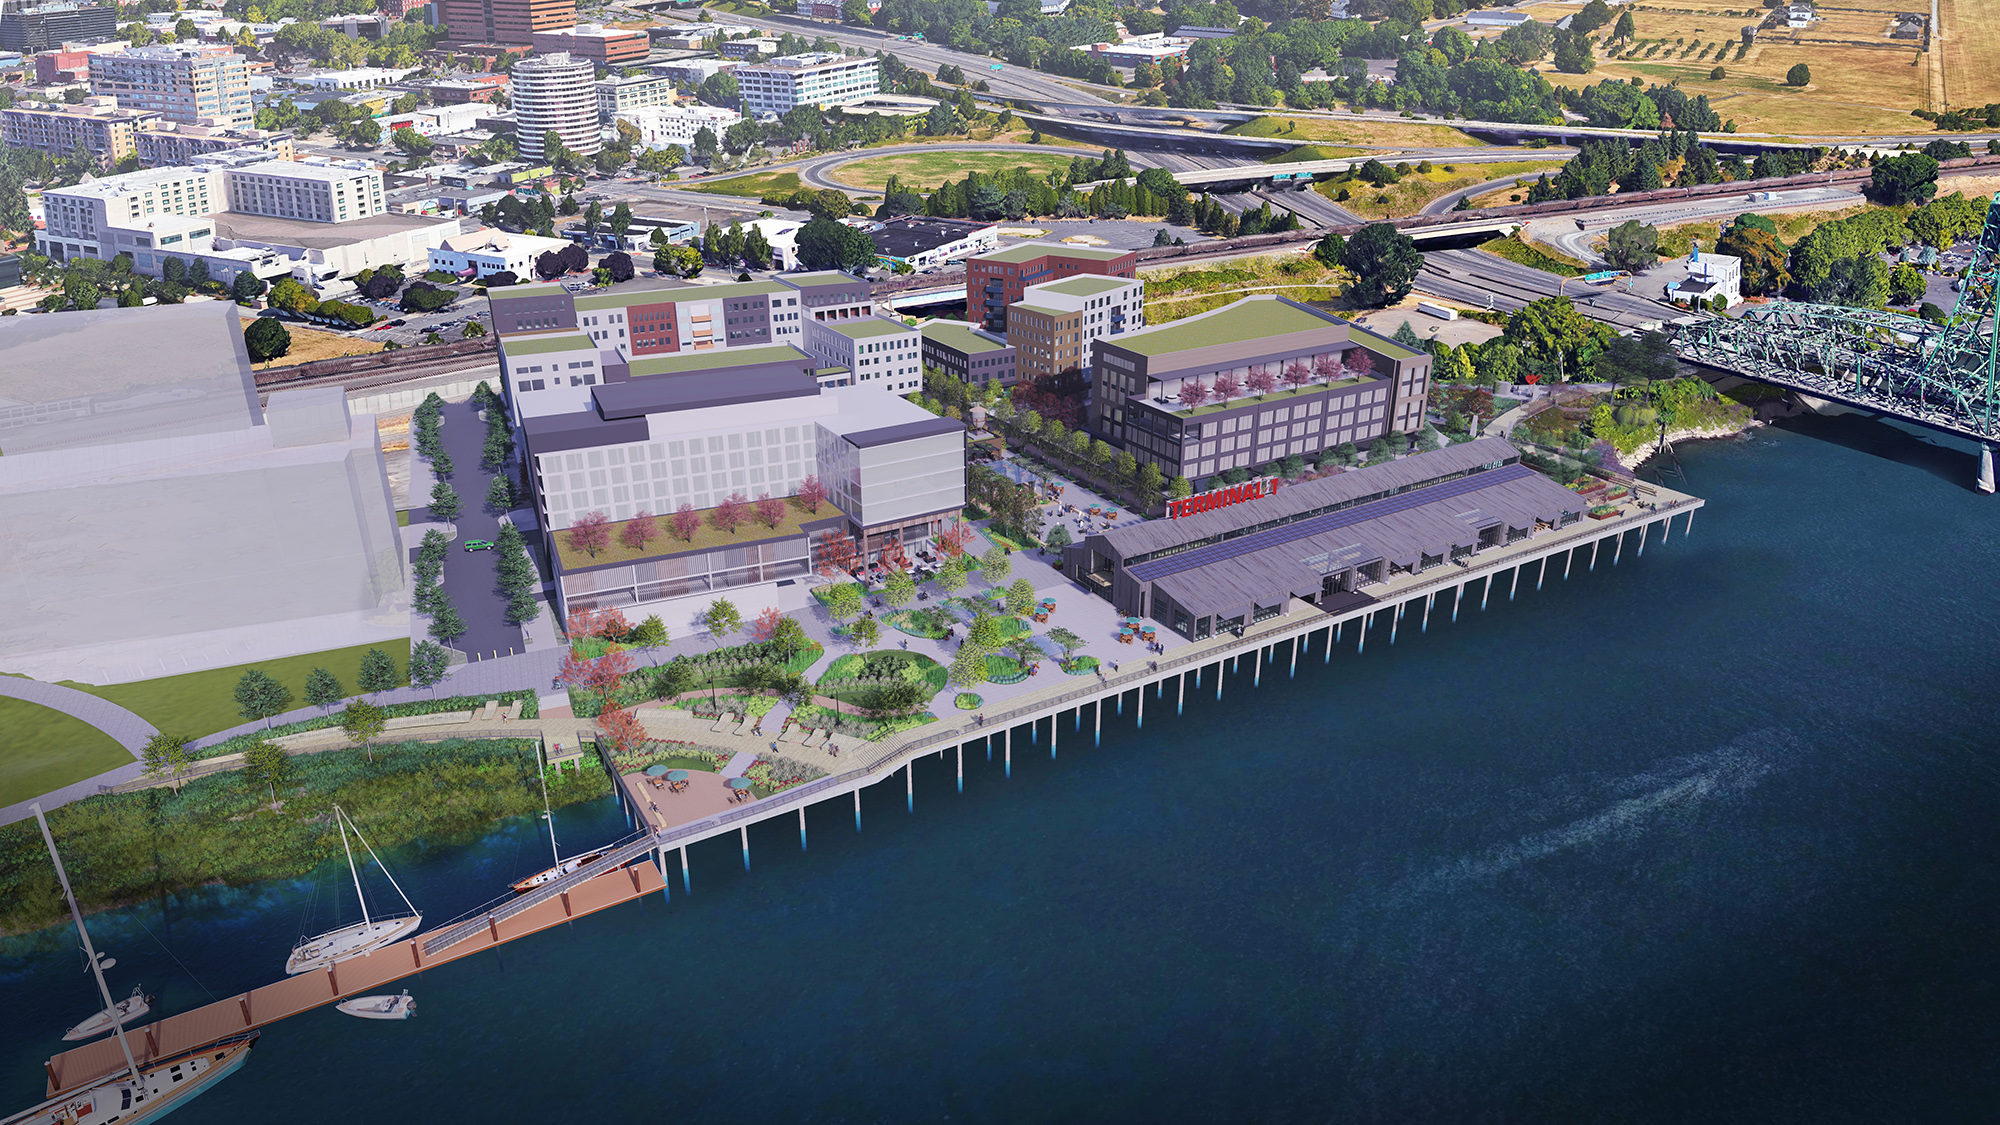
HEADER: Port of Vancouver, Terminal 1 Development in Vancouver, WA – image via Greenworks

2 thoughts on “Daily Drawdown 5: Buildings & Cities”