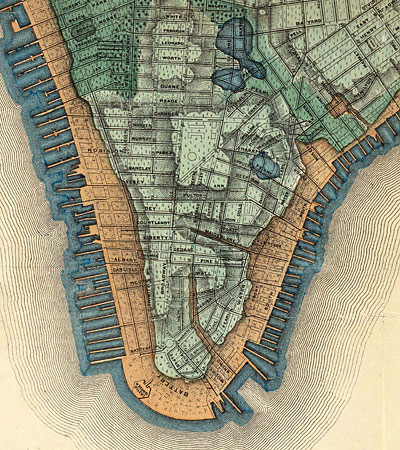
My fascination with historical mapping, particularly that focused on hydrology is a well known fact. A great resource spotted via Seeing Landscapes and Watershed+ gives a link to an older map of Manhattan published in the NY Times. ‘When There Was Water, Water Everywhere‘ looks at the 1874 map prepared by Col. Egbert L. Viele, a civil engineer that prepared the map replete with “a vividly detailed concoction of pinks and varying shades of green, shows the city’s natural springs, marshes and meadowlands.”
The maps have a utility today, as noted, to inform us about the underlying history that we have attempted to erase, but indeed persists. As noted in the article, the map is referenced by builders, developers, architects and more to find out the underlying history of a place.
“In illuminating what the island looked like before it was filled in, paved over, dug up and forested with skyscrapers, the map provides information Manhattan builders find indispensable: where former underground streams are; where soil quality might be poor because of erosion; where the island’s original shoreline ends and landfill begins. Despite its age, the map will most likely never be outdated or improved upon, in part because it would be nearly impossible to trace the island’s streams today.”
Viele is more than an interesting footnote in landscape architecture history – having been politically outmaneuvered and usurped on a number of projects by Olmsted and Vaux, including Central Park and a later Prospect Park. His mapping skills perhaps outweigh his park planning and political skills – as the full map is worth seeing. Anyone know where to get your hands on one?
The history of Manhattan is interesting as well in the context of recent evacuation of NYC prior to the landfall of Superstorm Sandy. The fantastic Visualizing Systems site has a post on ‘The Agency of the Contour‘ which links to Manhattan Past, and the Hurricane Sandy evacuation plan. As mentioned by Visualizing Systems “Water has a funny way of underscoring the agency of the “invisible” contour line.”
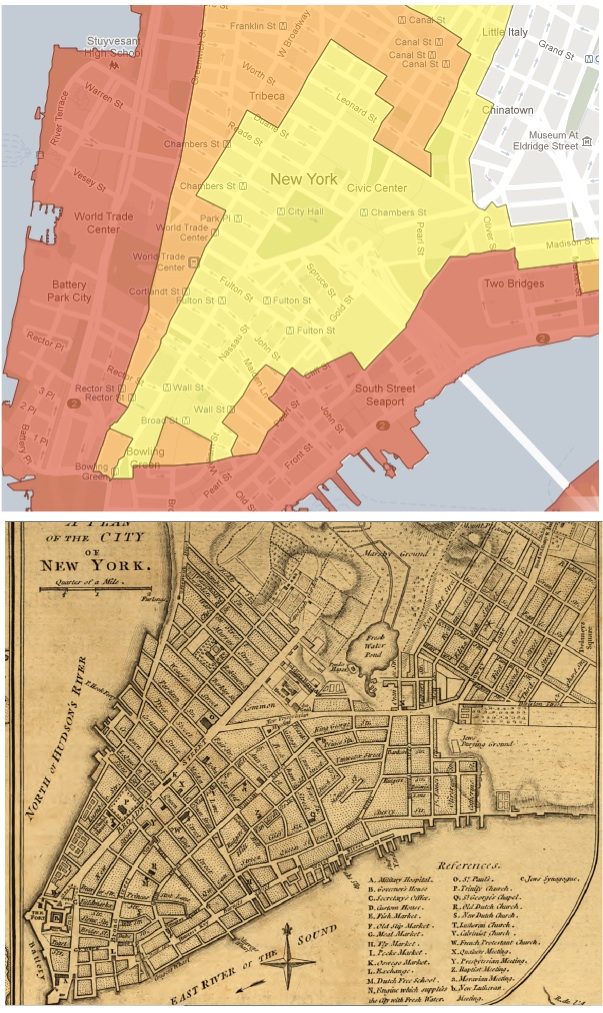
The maps reveal Lower Manhattan’s historic waterfront which was constructed on fill and the relationship between high water and storm surge in relation to the evacuation zones (top map).
The historical maps again inform the more recent events – quoting from Manhattan Past.
It is interesting to compare the evacuation map to a 1776 map of the island before much of the coastline was augmented by landfill. The eastern line of Zone A along the Hudson River runs along Greenwich Street, which was at the waterfront in 1776. The old slips on the East River extend inland to Queen Street, now Pearl Street, which is near where Zone A runs along the East River.
Also notable on the 1776 map is Bayard’s Mount, the high land rising in the area marked “Marshy Ground” north and northwest of the old Collect Pond. The pond was drained in the early 19th Century and Bayard’s Mount was leveled to fill it in, but as can be seen in the evacuation plan, the pond and the marsh left their mark on modern Manhattan in the form of a hook-shaped low area delineated by the border of Zone B.